This post is to provide you with the ready-to-use steps to calculate the most strategic KPIs with the help of Google Analytics data.
Cost of customer acquisition
This KPI shows the cost to acquire one customer (how much you invested in online marketing). To calculate it, divide total marketing campaign costs by the number of customers acquired. To get actionable insights, evaluate traffic channels and online campaigns separately. Here’s how:
САС = МСС ÷ СА
CAC Cost of customer acquisition
MCC Total marketing campaign costs related to acquisition (not retention)
CA Total customers acquired
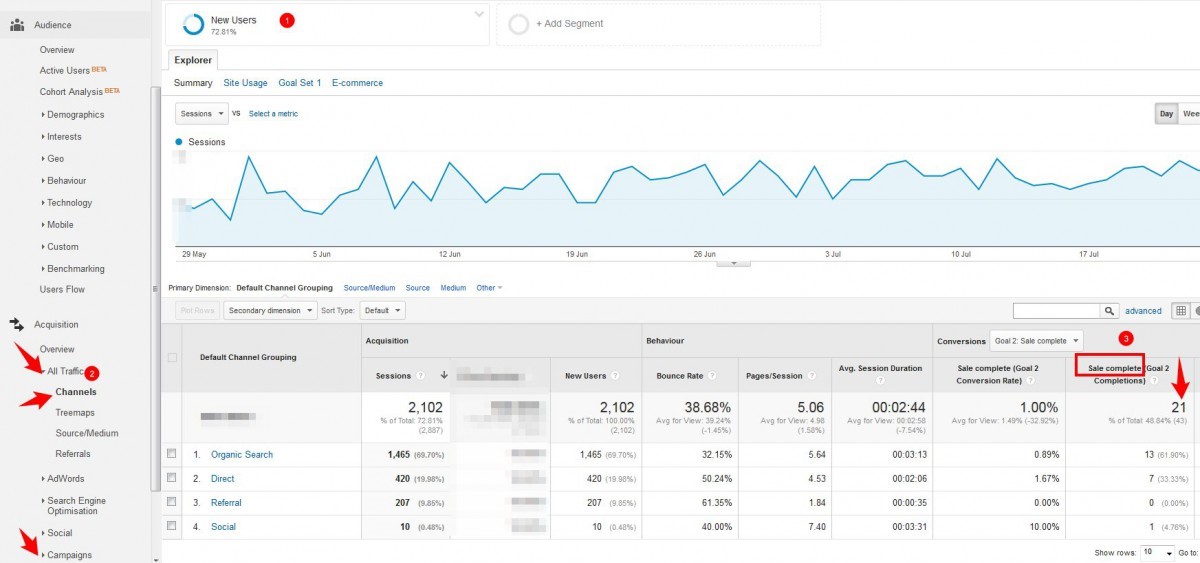
To get the number of customers acquired, set up a goal that will represent a purchase on your site. Then go to the reports on the marketing campaign or channel results and check the conversions block.

Conversion of a channel/campaign
This KPI shows the percentage of visits your site has and been transformed into potentials leads. To estimate the total Conversion Rate, a total number of conversions are divided by the total number of visits.
What kind of indicators should be treated as conversions depends on your goals. You may set up various e-commerce goals and track their Conversion Rate separately.
Conversion Rate is often used to measure landing page effectiveness, as it indicates which page has the best content and potential to provide the most optimal user experience.

Shopping cart abandonment rate
This KPI shows the percentage of activity and non-purchasing by the user. The metric is calculated by dividing the number of orders placed by the number of shopping carts created. In simple terms which means the number of user visits during which a user has added an item to the shopping cart, but hasn’t reached the check-out point.
Unlike a brick-and-mortar store, in online retail this metric is essential. In Google Analytics this metric is easy to arrive at and visualize with several goals setup too. Firstly, create at least two goals in Google Analytics:
- One which tracks the number of time users completed the add to cart action
- One which shows the check-out success or thank you page viewed by the user

Average order value
This KPI is easy and a well-known metric, which can be known by calculating the revenue received from sales divided by the number of orders taken.
The list by far is not exhaustive. However, these four key metrics could be a good starting point
Let me note, that for tightening together web traffic and financial goals, e-commerce tracking and goals set up are must-haves in your Google Analytics account. How to set up goals and e-commerce tracking you can read here and here.


%20one%20can%E2%80%99t%20ignore%20to%20charge%20Magento%20performance.png)
