Monitoring and tracking the events on cloud is a great topic of interest among system administrators who are in constant search of better solutions to suffice their needs.
A routine job of the server administrator is to have an in-depth look into the events on affecting server performances and its analytics. In addition, their job also involves predicting the performances with continual improvements; to enhance performance and secure the infrastructure.
When it comes to having great power of analytics over logs with a truly scalable solution to analyse bulks of logs in few seconds, Graylog is a total winner. Also the vibrant community support and the amazing feature and new improvements that are brought in with the latest versions are really great to find the log analytics becoming more of fun now.
The logging solutions is a great add-on to the Amazon VPC where the system administrator keeps a watch over the performance and events of the servers, right from system operations to application performance remotely .
The administration tasks are getting highly automated by the latest mail and SMS functionality that warns the administrators about the critical alerts and performance downfalls in the VPC.
Logs are diverse for different applications and formats surely differ. Right from logging each event to each exception, Graylog supports extended functionality to parse your logs before they are written out there on the disk. It is worth exploring the drools regex formats which Graylog uses to parse all its logs.
Each and every log hitting theGraylog can be evaluated against the drools regex to log the message in the most effective and useable format.
The Drools functionality comes with in-built support by enabling the Graylog.drl the drool rules files in the Graylog configuration.
The set of rules in the Graylog.drl can be customized to parse the relevant log and extract the important files in the message.
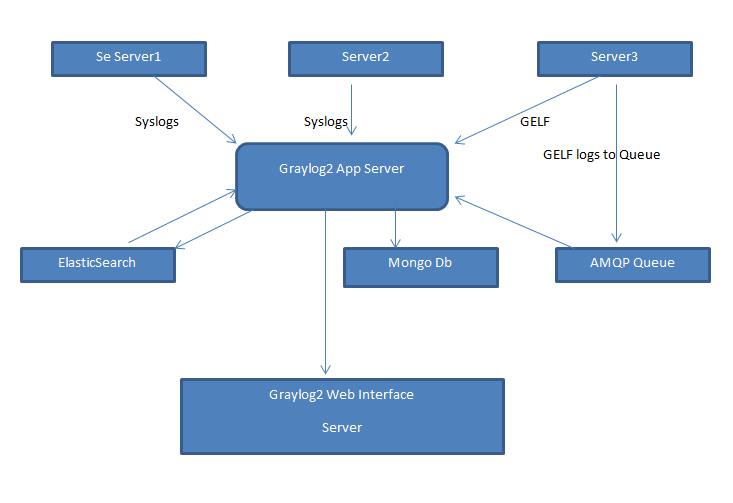
Along with parsing the messages of Graylog itself, the GELF Loggers supported in diverse languages including per, python, java, .NET etc. play it easy to log application level logs to Graylog. The GELF Format can be pre-parsed and sent in JSON String or zipped format over UDP to the Graylog server.
This was about parsing the logs, but what is more interesting is the capability to scale under load conditions and message queuing under load conditions.
Graylog logger App server can be scaled up to multiple instances logging into same Elastic Search bucked in events of high Message logging.
Multiple Graylog servers behind the load balancer help in taking up the load, the Elastic Search with its smart searching and storing tactics make up most of the Graylog functionality.
The Graylog Radio (yeah radio that reminds me of my old radio) is the queuing mechanism to queue up all your logs in the event your Graylog is shut down and flush them to Graylog when necessary which ensures no log message is lost and we achieve a high message acquisition in large production systems.
Thus Graylog turns out to be a great logging solution for not only small infrastructure, but also for larger infrastructures. All the Graylog logs are stored in ElasticSearch in the index shared model where indexes are filled up on message count basis. Graylog’s latest versions support time based retention of logs so along with the previous message count wise retention.
A full control over nodes and in-depth look into the Graylog cluster is certainly an added benefit of the latest version of Graylog.
What is more promising is the user-friendly Web Interface and major improvements in the feature list right from advanced level analytics support to graphing the logged data and customizable graphing UI. All this makes Graylog a perfect logging companion for larger enterprise architectures.


%20V5-05.jpg)


