Monitoring of the server is very important to save your project environment from any problems. It becomes the basic need to ensure that systems, application, and services are functioning properly. Monitoring also surfaces any network or server problem, digs up the root causes of issues, and maintains security. Further, it resolves several system errors: low memory, and unreachable server. It helps in troubleshooting server performance issues. It automatically fixes problems when detected and also monitors the entire infrastructure and business process. Continuous Monitoring is, therefore, an important part of DevOps life-cycle.
To continuously monitor, we have many tools like Nagios, Splunk, Sensu etc. Let's focus on Nagios, which is a continuous monitoring tool to monitor a system, application, service etc. It helps to detect the issues and help to send alerts to technical staff and customers through SMS on a registered mobile number, or over email. It helps to reduce the downtime of servers and supports both physical and virtual machines. It adds redundancy to the system. Nagios works like a client-server model. Nagios runs on the server as a service. It periodically runs plugins on the same server that contacts hosts or servers on the internet or network. Then the status information can be viewed by a web interface.
We can also write shell script according to problems we want to solve or can also use plugins which can be downloaded.
NRPE (Nagios Remote Plugin Executor) allows to remotely execute Nagios Plugins on the Linux or window machines which we are using as a client. It allows users to monitor remote machines their disk usage, CPU load, FTP check etc.
Install Nagios Core:
For Host Server (CentOS 6.8)
Step 1. Before we install Nagios, we need to install some required packages.
- Commands:
Step 2. Install Nagios Core, Nagios Plugins and NRPE. Apache web server is required for monitoring the current status and PHP is required for web interface.
- Commands:
This command will help to install Nagios, Nagios Plugins, Plugins for NRPE, NRPE, Apache and PHP in host server
- yum -y install nagios nagios-plugins-all nagios-plugins-nrpe nrpe httpd php
To enable Apache and Nagios server.
- chkconfig httpd on && chkconfig nagios on
To start Apache -
- service httpd start
To start Nagios -
- service nagios start

Step 3. Set the Nagios Password to access the web interface. After that go to the browser and type ur IP /nagios . It will ask for a username and password. Also, open port 5666 as Nagios runs on this port.
Command:
- htpasswd -c /etc/nagios/passwd nagiosadmin
Set the password you want
 Finally, you will see :
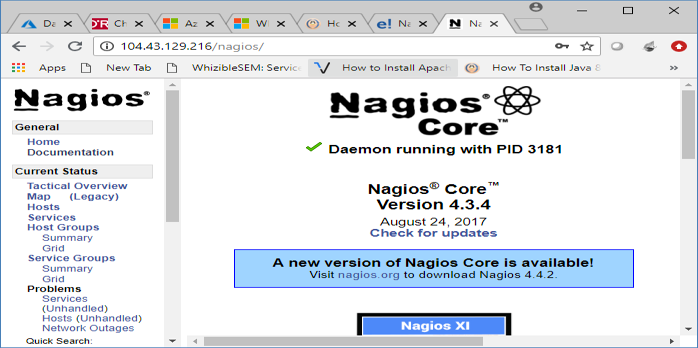
Click on hosts and you can see the monitoring done by Nagios core.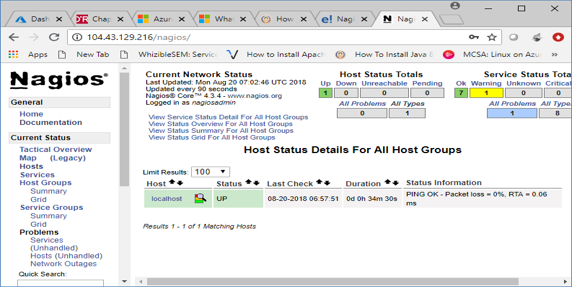
Install NRPE in client servers which you want to monitor:
Step 1. Before we install NRPE we need to install some required packages.
- Commands:
- rpm -Uvh http://dl.fedoraproject.org/pub/epel/epel-release-latest-6.noarch.rpm
- rpm -Uvh http://rpms.famillecollet.com/enterprise/remi-release-6.rpm
Step 2. Now install Nagios, Nagios plugins and NRPE in client server.
Command:
- yum -y install nagios nagios-plugins-all nrpe
Step 3. To enable NRPE service
- Command:
- chkconfig nrpe on
Now edit the nrpe.cfg file. Add the host server IP there.
Step 4. Now, Start NRPE service
Command:
- Service nrpe start

Now go back to Monitoring server:
Step 1. Edit nagios.cfg file.
Command:
- vi /etc/nagios/nagios.cfg
uncomment the line – cfg_dir = etc/nagios/servers
Step 2. Now make a ‘server’ directory
Command:
- mkdir /etc/nagios/servers
Step 3. Create a file in ‘server’ directory
Command:
- vi /etc/nagios/servers/client.cfg
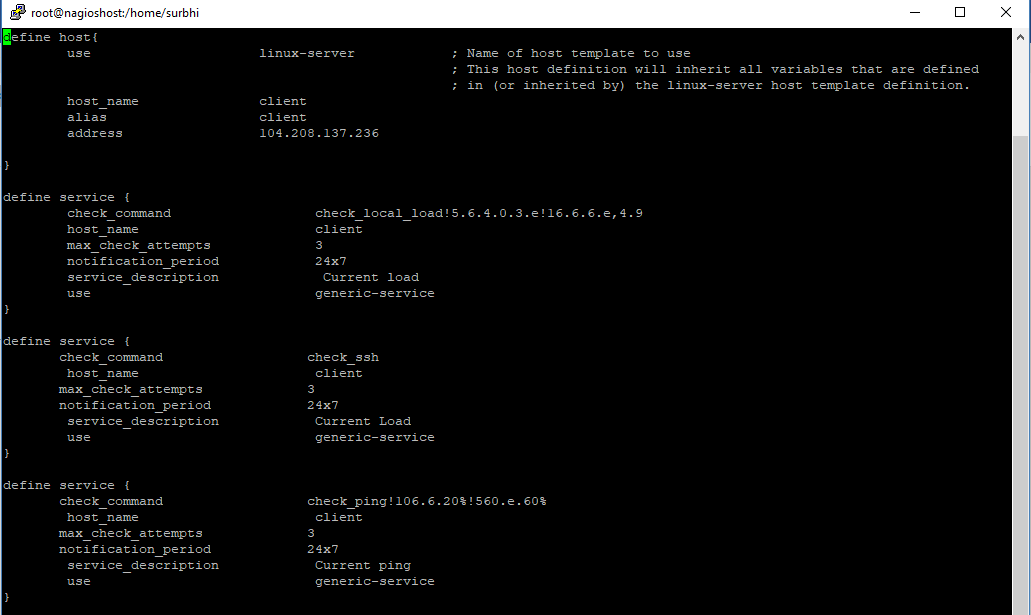
Step 4. Now, set the folder permission and restart the Nagios.
Commands:
- chown -R nagios. /etc/nagios/
- service nagios restart
Your Monitoring server is now ready to monitor both the client and host servers.
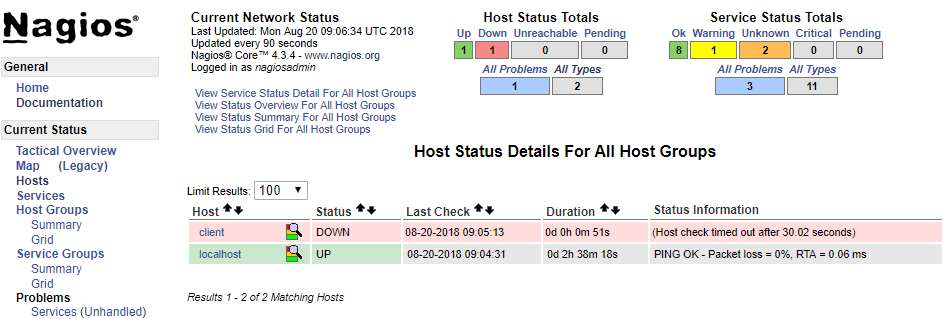

.jpg)

