Microsoft Power Platform is nothing but a combination of Power Apps (a platform for low-cost app development), Power BI (a business analytics platform) and Microsoft Flow (a workflow automation platform) into one powerful business application platform. This platform helps to build quick solutions, analyze data, automate business process and create virtual agents.
This blog is a part of a series that will cover each of these platforms that form a part of Microsoft Power Platform. In this first one, with inputs from Microsoft’s Power BI insights, we begin with an introduction to what Power BI is, how it can be used, and the classification of its users.
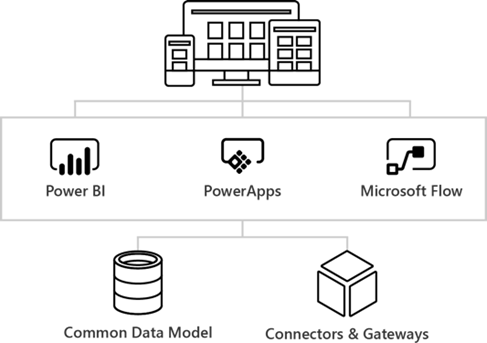
Microsoft Power Platform
Power BI
While working, you may receive different types of data, such as, Excel spreadsheets, Dashboards, Charts etc. Most of the time, it is difficult for you to find the exact information that you are looking for. There is also an added risk that you are not referring to the latest version of the data.
Power BI helps you to manage all this data more effectively by converting it to different types of charts, graphs and dashboards, thus making it easier for you to read and analyze the data. Instead of traditional lists and tabular methods of representing data, Power BI provides you more colorful and compelling visuals.
Broadly, we could categorize Power BI users into four different categories depending on how they use the Power BI platform:
- Power BI User/Consumer
- Power BI Report Designer
- Power BI Administrator
- Power BI Developer
Power BI Consumer
As a Power BI consumer, you could use the Power BI service (Online version of Power BI) in order to interact with the dashboard and reports you receive. You could apply different types of filters, export and slice data without affecting the original data-set.
Power BI Report designer
As a Power BI Report designer, you could leverage the Power BI desktop app to connect, transform and visualize your data. Power BI desktop has the capability to connect to multiple and different sources of data and combine them into a single data model.
The most common uses for Power BI Desktop are as follows:
- Connect to data
- Transform and clean that data, to create a data model
- Create visuals, such as charts or graphs, that provide visual representations of the data
- Create reports that are collections of visuals, on one or more report pages
- Share reports with others by using the Power BI service
Power BI Administrator
As a Power BI administrator, you could do all management activities of a Power BI tenant. This includes configuration of governance policies, usage monitoring, license, capacity and organizational resource provisioning.
Administrator roles related to Power BI
There are several roles related to Power BI administration, which are covered in the following table.
|
Type of administrator |
Administrative scope |
Power BI scope |
|
Office 365 Global Administrator |
Office 365 |
Can manage all aspects of a Power BI tenant and other services. |
|
Office 365 Billing Administrator |
Office 365 |
Can acquire Power BI licenses through Office 365 subscriptions. |
|
Power BI Service Administrator |
Power BI tenant |
Has full control over a Power BI tenant and its administrative features (except for licensing). |
|
Power BI Premium Capacity Administrator |
A single Premium capacity |
Has full control over a premium capacity and its administrative features. |
|
Power BI Embedded Capacity Administrator |
A single Embedded capacity |
Has full control over an embedded capacity and its administrative features. |
Power BI Developer
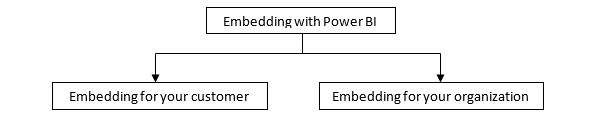
As a Power BI Developer, you could get different options to integrate Power BI content into your application such as embedding with Power BI, custom visuals, and pushing data into Power BI. In your custom application, you could use API provided for Power BI services (SaaS) and Power BI Embedded service in Azure (PaaS) to integrate dashboard and Reports.
Developing custom visuals
In order to meet the company-specific requirement you could use custom visual option. Any developer with a good understanding of Typescript, CSS and basics of programming including variables, looping and conditioning could easily work on writing custom visuals and meet customer requirements.
Using API automation
As a developer, if you are familiar with any programming language which supports REST calls then you could write your own app’s which integrate Power BI dashboard, reports.
Now that we have covered the first of the applications that make up the Microsoft Power Platform service, in the next one we shall be talking about the business analytics platform, Microsoft Power BI.
%20V2-03-03-03.jpg)