Reporting is a major activity across all businesses. However, it is the visual impact of a report which makes it more interesting and readable to the user. Any presentation or report must contain information which is easily understood by any user at a glance. An image or a chart offer the best visual impact tolls in your report. Google has introduced an easy way of plotting graphs. They provide an api which provides you a chart or an image map with hotspot.
Google api is defined as
https://chart.googleapis.com/chart?cht=<chart_type>&chd=<chart_data>&chs=<chart_size>&...additional_parameters
All URLs start with https://chart.googleapis.com/chart? followed by the parameters that specify chart data and appearance. Parameters are name=value pairs, separated by an ampersand character (&), and parameters can be in any order, after the?. All charts require, at minimu, the following parameters: cht (chart type), chd (data), and chs (chart size).
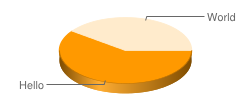
Here is simple example of a Google api. For instance, if I pass the variables as
https://chart.googleapis.com/chart?cht=p3&chs=250x100&chd=t:60,40&chl=Hello|World
You can find the live code as well:
https://developers.google.com/chart/
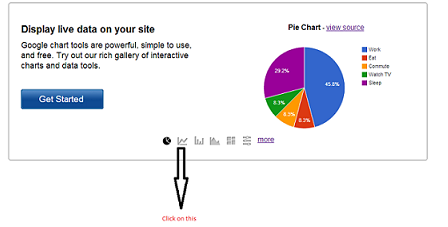
When you click on the arrow shown, you can see various charts for the same data by just changing the chart type.
The following link show the various ways in which you can post the request for a chart:
https://developers.google.com/chart/image/docs/post_requests
Chart parameters can be found at:
https://developers.google.com/chart/image/docs/chart_params
Number of charts provided can be found at
https://developers.google.com/chart/image/docs/gallery/chart_gall
In essence, Google Charts can be used on any platform and language using one of these methods.
So, decorate your next report with these awesome Google Charts. Start Googling now!