What is HICHERT®SUCCESS?
Prof Dr. Rolf Hichert wanted to make business communication most successful. He initiated the SUCCESS formula of the International Business Communication Standards (IBCS®), a community driven set of design rules for successful reports and presentations.
Today, the HICHERT®SUCCESS presentation concept counts among the leading methods of ensuring successful business communication.
Visualizations of business figures have a significant importance for HICHERT®SUCCESS. Visualizations help make business data easier to understand. It helps to generate a clear picture of business critical data.
You can find more details about Hichert report templates at http://www.hichert.com/
Recently, I came across a reporting requirement when a CFO wanted to implement “Hichert Charts” in MicroStrategy. There is no in-built chart type in MicroStrategy for Hichert charts, but MicroStrategy provides lot of graph options that we can use to achieve the similar visualization. In this blog, I will discuss about how to create Hichert style horizontal bar chart in MicroStrategy.
Let’s look at one of the IBCS chart template below: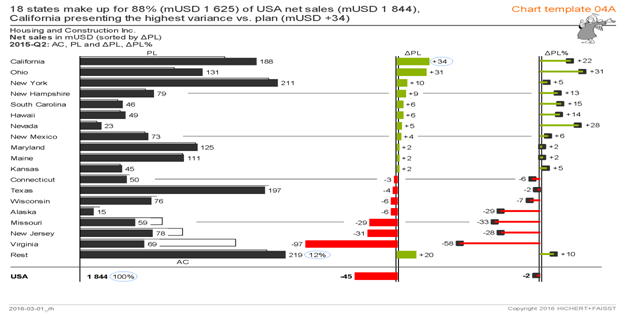
The above chart shows plan variance and plan variance % in addition to plan across city.
Let's first create a basic chart in MicroStrategy by following below steps:
- Select the Horizontal Bar Chart MicroStrategy Report / Document.
- Create a document in MicroStrategy. Assign Data Source to it.
- Select a horizontal bar graph and add it in the document.
- Add the required Attribute and Metric for the chart, for e.g. if we want to build a chart like above, then select City as an attribute and Plan Variance% as a Metric.
- Add the thresholds to show positive variance in green colour and negative in red colour.
- Change chart properties.
MicroStrategy Web has limited chart options. Hence, to use this we will have to go to MicroStrategy Developer tool and make this chart look like a HICHERT chart. Open the document in MicroStrategy Developer. Right click on the chart and Select Graph Options.
Change the chart properties as below:- Reduce Gap Width:
Reduce the gap width to 90 to make the horizontal bars slimmer.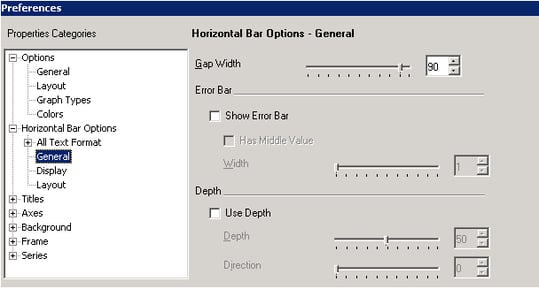
- Add Custom Line at 0:
Add a custom line at 0. Also check “Always Include Zero in this Scale” option.
This will ensure that we always see default line at 0.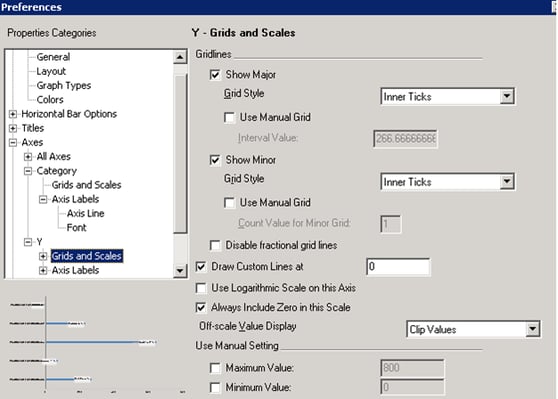
- Show Labels:
Select Label Location as “Inside Maximum”. Select Label Box Style to “Single”. Colour the box with grey colour.

You can also hide Category Axes Labels if required. Now the horizontal bar chart looks like below:

- Reduce Gap Width:
As we have just seen, by using wide range of options provided, we can achieve HICHERT Chart Style in MicroStrategy.