

Open Office XML (also known as OOXML or OpenXML) is a XML based file format developed by Microsoft for representing office documents. An OOXML file is stored in zipped, XML files.
Spreadsheet documents in OOXML mainly contain following parts,
|
xl |
worksheets |
_rels |
sheet1.xml.rels |
|
sheet1.xml |
|||
|
andxmls depending on sheets . |
|||
|
theme |
theme1.xml |
||
|
drawings |
_rels |
drawing1.xml.rels |
|
|
drawing1.xml |
|||
|
charts |
chart1.xml |
||
|
_rels |
workbook.xml.rels |
||
|
workbook.xml |
|||
|
styles.xml |
|||
|
sharedStrings.xml |
|||
|
docProps |
|||
|
_rels |
|||
|
[Content_Types].xml |
We are going to talk about drawings and the chart parts in this blog.
Inserting chart in Excel
We will go through various chart objects in the following sections,
- DrawingsPart
To insert any type of drawing objects in office documents DrawingsPart is base part in which we append child elements.
The drawing1.xml looks like,
<?xml version="1.0" encoding="UTF-8" standalone="yes" ?>
<xdr:wsDr xmlns:xdr="http://schemas.openxmlformats.org/drawingml/2006/spreadsheetDrawing"xmlns:a="http://schemas.openxmlformats.org/drawingml/2006/main">
<xdr:twoCellAnchor>
<xdr:from>
<xdr:col>4</xdr:col>
<xdr:colOff>0</xdr:colOff>
<xdr:row>5</xdr:row>
<xdr:rowOff>0</xdr:rowOff>
</xdr:from>
<xdr:to>
<xdr:col>8</xdr:col>
<xdr:colOff>0</xdr:colOff>
<xdr:row>13</xdr:row>
<xdr:rowOff>0</xdr:rowOff>
</xdr:to>
<xdr:graphicFrame macro="">
<xdr:nvGraphicFramePr>
<xdr:cNvPrid="1067" name="Chart2" />
<xdr:cNvGraphicFramePr/>
</xdr:nvGraphicFramePr>
<xdr:xfrm>
<a:offx="0" y="0" />
<a:extcx="0" cy="0" />
</xdr:xfrm>
<a:graphic>
<a:graphicDatauri="http://schemas.openxmlformats.org/drawingml/2006/chart">
<c:chartxmlns:c="http://schemas.openxmlformats.org/drawingml/2006/chart" xmlns:r="http://schemas.openxmlformats.org/officeDocument/2006/relatioships" r:id="rId1" />
</a:graphicData>
</a:graphic>
</xdr:graphicFrame>
<xdr:clientData/>
</xdr:twoCellAnchor>
</xdr:wsDr>
Key parts in above XML are,
Drawing part is a common object in all sheets of spreadsheet. It can be added in worksheet part as below,
DrawingsPartdrawingsPart = null; // Add a new drawing to the worksheet. if (worksheetPart.DrawingsPart == null) { drawingsPart = worksheetPart.AddNewPart<DrawingsPart>(); worksheetPart.Worksheet.Append(newDocumentFormat.OpenXml.Spreadsheet.Drawing() { Id = worksheetPart.GetIdOfPart(drawingsPart) }); worksheetPart.Worksheet.Save(); } else { drawingsPart = worksheetPart.DrawingsPart; }- TwoCellAnchor:
TwoCellAnchor is used to set chart position in worksheet. It can be set by using the following two classes,
- FromMarker
- ToMarker
FromMarker is used to specify from position of chart using From excel column and From excel row.
ToMarker is used to specify position of chart using To excel column and To excel row.
Following code specifies position of charts,
// Position the chart on the worksheet using a TwoCellAnchor object. if (drawingsPart.WorksheetDrawing == null) drawingsPart.WorksheetDrawing = newWorksheetDrawing(); TwoCellAnchortwoCellAnchor = drawingsPart.WorksheetDrawing.AppendChild ‹TwoCellAnchor ›(newTwoCellAnchor()); twoCellAnchor.Append ( newDocumentFormat.OpenXml.Drawing.Spreadsheet.FromMarker ( newColumnId("5"), newColumnOffset("0"), newRowId("5"), newRowOffset("0") ) ); twoCellAnchor.Append ( newDocumentFormat.OpenXml.Drawing.Spreadsheet.ToMarker ( newColumnId("10"), newColumnOffset("0"), newRowId("15"), newRowOffset("0") ) ); - GraphicFrame:
Frame of the graph can be added using GraphicFrame. Following code adds frame of the chart,
// Append a GraphicFrame to the TwoCellAnchor object. DocumentFormat.OpenXml.Drawing.Spreadsheet.GraphicFramegraphicFrame = twoCellAnchor.AppendChild ‹DocumentFormat.OpenXml.Drawing.Spreadsheet.GraphicFrame ›(newDocumentFormat.OpenXml.Drawing.Spreadsheet.GraphicFrame()); graphicFrame.Macro = ""; graphicFrame.Append ( new DocumentFormat.OpenXml.Drawing.Spreadsheet.NonVisualGraphicFrameProperties ( new DocumentFormat.OpenXml.Drawing.Spreadsheet.NonVisualDrawingProperties() { Id = 2u, Name = "Chart2";}, new DocumentFormat.OpenXml.Drawing.Spreadsheet.NonVisualGraphicFrameDrawingProperties() ) ); graphicFrame.Append(newTransform(newDocumentFormat.OpenXml.Drawing.Offset() { X = 0L, Y = 0L }, newDocumentFormat.OpenXml.Drawing.Extents() { Cx = 0L, Cy = 0L })); graphicFrame.Append(newDocumentFormat.OpenXml.Drawing.Graphic(newDocumentFormat.OpenXml.Drawing.GraphicData(newChartReference() { Id = drawingsPart.GetIdOfPart(chartPart) }) { Uri = "http://schemas.openxmlformats.org/drawingml/2006/chart" })); twoCellAnchor.Append(newClientData()); // Save the WorksheetDrawing object. drawingsPart.WorksheetDrawing.Save(); - TwoCellAnchor:
- ChartPart
We can create new Chart using ChartPart class. Following code creates new chart and sets it’s editing culture,
// Add a new chart and set the chart language to English-US.
ChartPartchartPart = drawingsPart.AddNewPart<ChartPart>();
chartPart.ChartSpace = newChartSpace();
chartPart.ChartSpace.Append(newEditingLanguage() { Val = newStringValue("en-US") });
Chart can be created using,
DocumentFormat.OpenXml.Drawing.Charts.Chart chart =
chartPart.ChartSpace.AppendChild ‹DocumentFormat.OpenXml.Drawing.Charts.Chart›(newDocumentFormat.OpenXml.Drawing.Charts.Chart());

chart.AppendChild<AutoTitleDeleted>(newAutoTitleDeleted() { Val = BooleanValue.FromBoolean(false) });

chart.Append(newPlotVisibleOnly() { Val = newBooleanValue(true) });
chart.Append(newDisplayBlanksAs() { Val = DisplayBlanksAsValues.Gap });
Once Chart is created, Chart plot area can be created using,
PlotAreaplotArea = chart.AppendChild ‹PlotArea›(newPlotArea());
Chart plot area is main chart object which is used to create objects like Layout, BarChart, Chart axes.
- Barchart
In this blog we are going to create Bar chart. Bar chart, chart series and other properties of bar chart that can be created using,
Layoutlayout = plotArea.AppendChild<Layout>(newLayout()); BarChartbarChart = plotArea.AppendChild<BarChart> ( newBarChart ( newBarDirection() { Val = newEnumValue ‹BarDirectionValues ›(BarDirectionValues.Bar) }, newBarGrouping() { Val = newEnumValue ‹BarGroupingValues ›(BarGroupingValues.Clustered) } ) );And add chart axis as below,
barChart.Append(newAxisId() { Val = newUInt32Value(48650112u) });
barChart.Append(newAxisId() { Val = newUInt32Value(48672768u) });
Bar Chart has the following part,
- BarChartSeries
- DataPoint
- CategoryAxisData
- Values
Chart series is created using the following code,
BarChartSeriesbarChartSeries = barChart.AppendChild<BarChartSeries> ( newBarChartSeries ( newIndex() { Val = newUInt32Value(0u) }, newOrder() { Val = newUInt32Value(0u) }, newSeriesText(newNumericValue() { Text = chartDetails.ChartTitle }) ) );Data points are nothing but bars in Bar charts. These bars can be formatted using
DataPointdpFirstName  =barChartSeries.AppendChild ‹DataPoint›(newDataPoint());
dpFirstName.Index = newIndex();
dpFirstName.Index.Val = 0u;
dpFirstName.InvertIfNegative = newInvertIfNegative() { Val = BooleanValue.FromBoolean(true) };
dpFirstName.Bubble3D = newBubble3D() { Val = BooleanValue.FromBoolean(false) };

DocumentFormat.OpenXml.Drawing.Charts.ShapePropertiesspDataPoint = dpFirstName.AppendChild<DocumentFormat.OpenXml.Drawing.Charts.ShapeProperties>
 (
	newDocumentFormat.OpenXml.Drawing.Charts.ShapeProperties()
);
spDataPoint.Append(newDocumentFormat.OpenXml.Drawing.SolidFill() { RgbColorModelHex = newDocumentFormat.OpenXml.Drawing.RgbColorModelHex() { Val = newHexBinaryValue("FF00FF") } });
Color of each bar can be changed using the above code. Index objectofdata pointis referred for each bar in bar chart starting from 0.
Category axis values are mentioned using following code,
CategoryAxisDataobjCAD = barChartSeries.AppendChild ‹CategoryAxisData ›(newCategoryAxisData());

StringReferencestrRef = newStringReference();

strRef.Formula = newDocumentFormat.OpenXml.Drawing.Charts.Formula("Sheet1!$B$2:$B$5");
strRef.StringCache = newStringCache();
strRef.StringCache.PointCount = newPointCount() { Val = Convert.ToUInt32(data.Keys.Count) };

uintkeyCnt = 0;

foreach (string key indata.Keys)
{
strRef.StringCache.AppendChild ‹NumericPoint ›(newNumericPoint() { Index = keyCnt, NumericValue = newNumericValue(key) });
}

objCAD.AppendChild<StringReference>(strRef);
Here data is input data and its object type isDictionary
. Series values are mentioned using the following code,
DocumentFormat.OpenXml.Drawing.Charts.Values values = barChartSeries.AppendChild ‹DocumentFormat.OpenXml.Drawing.Charts.Values ›(newDocumentFormat.OpenXml.Drawing.Charts.Values());

NumberReferencenumRef = newNumberReference();

numRef.Formula = newDocumentFormat.OpenXml.Drawing.Charts.Formula("Sheet1!$C$2:$C$5");
numRef.NumberingCache = newNumberingCache();
numRef.NumberingCache.PointCount = newPointCount() { Val = Convert.ToUInt32(data.Keys.Count) };

uintkeyCnt = 0;

foreach (string key indata.Keys)
{
numRef.NumberingCache.AppendChild<NumericPoint>(newNumericPoint() { Index = keyCnt, NumericValue = newNumericValue(data[key].ToString()) });
keyCnt++;
}
values.AppendChild<NumberReference>(numRef);
Here data is input data and its object type isDictionary
. - CategoryAxis
- ValueAxis
Category axis is used to specify values like axis id, scaling, axis position, crossing axis and so on.
Following code creates category axis
CategoryAxiscatAx = plotArea.AppendChild<CategoryAxis> ( newCategoryAxis ( newAxisId() { Val = newUInt32Value(48650112u) }, newScaling(newOrientation() { Val = newEnumValue<DocumentFormat.OpenXml.Drawing.Charts.OrientationValues>(DocumentFormat.OpenXml.Drawing.Charts.OrientationValues.MinMax) }), newAxisPosition() { Val = newEnumValue<AxisPositionValues>(AxisPositionValues.Left) }, newDelete() { Val = newBooleanValue(false) }, newTickLabelPosition() { Val = newEnumValue<TickLabelPositionValues>(TickLabelPositionValues.Low) }, newCrossingAxis() { Val = newUInt32Value(48672768U) }, newCrosses() { Val = newEnumValue<CrossesValues>(CrossesValues.AutoZero) }, newAutoLabeled() { Val = newBooleanValue(true) }, newLabelAlignment() { Val = newEnumValue<LabelAlignmentValues>(LabelAlignmentValues.Center) }, newLabelOffset() { Val = newUInt16Value((ushort)100) }, newNoMultiLevelLabels() { Val = newBooleanValue(false) } ) );Value axis is same as Category axis, it is used to specify values like axis id, scaling, axis position, crossing axis and so on.
Following code creates value axis,
// Add the Value Axis. ValueAxisvalAx = plotArea.AppendChild ‹ValueAxis› ( newValueAxis ( newAxisId() { Val = newUInt32Value(48672768u) }, newScaling(newOrientation() { Val = newEnumValue ‹DocumentFormat.OpenXml.Drawing.Charts.OrientationValues ›(DocumentFormat.OpenXml.Drawing.Charts.OrientationValues.MinMax) }, newMaxAxisValue() { Val = newDocumentFormat.OpenXml.DoubleValue(Convert.ToDouble(100)) }), newAxisPosition() { Val = newEnumValue<AxisPositionValues>(AxisPositionValues.Left) }, newMajorGridlines(), newDelete() { Val = newBooleanValue(false) }, newDocumentFormat.OpenXml.Drawing.Charts.NumberingFormat() { FormatCode = newStringValue("General"), SourceLinked = newBooleanValue(true) }, newTickLabelPosition() { Val = newEnumValue ‹TickLabelPositionValues›(TickLabelPositionValues.NextTo) }, newCrossingAxis() { Val = newUInt32Value(48650112U) }, newCrosses() { Val = newEnumValue ‹CrossesValues ›(CrossesValues.AutoZero) }, newCrossBetween() { Val = newEnumValue ‹CrossBetweenValues ›(CrossBetweenValues.Between) } ) );Chart XML, chart1.xml, looks like,
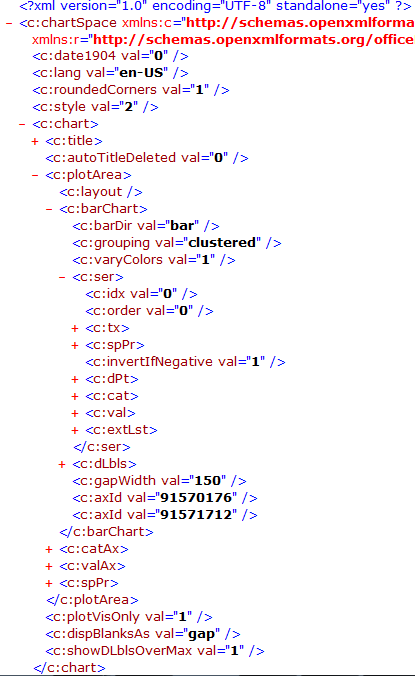
- Barchart
- Final Details
A sample bar chart generated using the above code is shown below
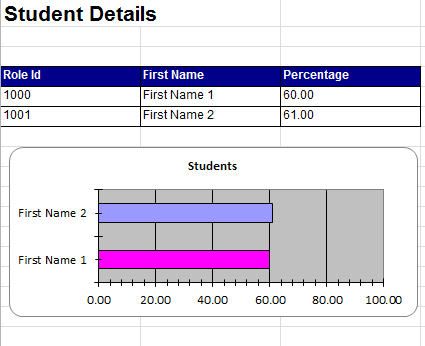
Click here to download Final code of inserting bar charts in Excel using OOXML and C#.