“Don’t Just Crunch Numbers. Crush Them”. Load massive amounts of data from virtually any source, process in seconds and model with powerful analytical capabilities
…Microsoft Business Intelligence
PowerPivot, an Excel add-in offered by Microsoft is one of the most powerful Business Intelligence and analytical tool. Being an add-in to MS Excel which is widely used by majority of computer users, this can be used to perform powerful data analysis, bringing self-service business intelligence to desktop.
By using PowerPivot for Excel, business users can transform enormous quantities of data with incredible speed into meaningful information to get the answers they need in just a few clicks.
This is achieved by -
- Taking advantage of familiar Excel tools and features
- Using powerful new analytical capabilities, such as Data Analysis Expressions (DAX)
- Loading even the largest data sets from virtually any source including Databases, Feeds, Reporting Services, and Flat Files
- Processing massive amounts of Data in seconds
Differences between Excel and PowerPivot Workbooks
There are few differences between Microsoft Excel and PowerPivot window. The major difference is in terms of how users work with data in each of these tools. Apart from this, below are some other important differences to be considered -
- Supported Workbook File Formats: PowerPivot data can be saved in workbooks having file types as Excel Workbook (*.xlsx), Excel Macro-Enabled Workbook (*.xlsm), and Excel Binary Workbook (*.xlsb). PowerPivot data is not supported in workbooks with other formats.
- Support to Visual Basic for Applications (VBA): The PowerPivot window does not support Visual Basic for Applications (VBA). Users can use VBA in the Excel window of a PowerPivot workbook.
- Data Grouping: In Excel Pivot Tables, users can group data by right-clicking a column heading and selecting Group. This is used to group data by date. In Pivot Tables that are based on PowerPivot data, user should use calculated columns to achieve the functionality.
Top features of PowerPivot for Excel
- Import millions of rows of data from multiple data sources: Using PowerPivot for Excel; business users can
- Import millions of rows of data from various multiple data sources into a single Excel workbook.
- Create relationships between heterogeneous data.
- Create calculated columns and measures using various formulas.
- Build Pivot Tables and Pivot Charts to further analyze the data to make timely business decisions all without requiring IT assistance.
- Enjoy fast calculations and analysis: This tool is capable of processing millions of rows in about the same time as thousands making the most of multi-core processors and gigabytes of memory for fastest processing of calculations. Using efficient compression algorithms to load bigger data sets into memory helps to overcome existing limitations for massive data analysis on the desktop.
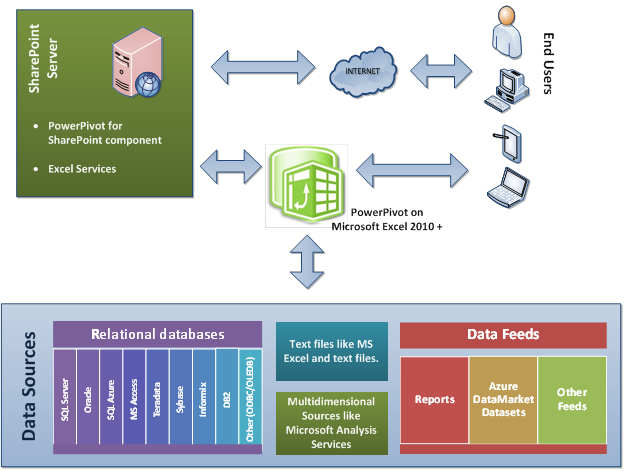
- Virtually Unlimited Support to various Data Sources:PowerPivot is capable of connecting, importing and combining various source data from any location for massive data analysis on the desktop. These data sources includes -
- Relational databases
- Multidimensional sources
- Data Feeds
- Text Files like Excel and text files
- Report published using reporting services
- Analysis services and other PowerPivot workbooks
- Cloud Services
- Data from the Web
- Security and Management: PowerPivot enables IT managers to monitor and manage shared applications ensuring security, availability, and performance.
- Data Analysis Expressions (DAX): DAX is a new formula language that extends the data manipulation capabilities of Excel which enables sophisticated and complex grouping, calculation, and analysis. The syntax of DAX formulas is very similar to that of Excel formulas.
Collaboration with SharePoint
Business users exchange files by various ways. PowerPivot workbook can be shared with others in all of the normal ways that users share files. Alternatively, PowerPivot workbooks can be published to a SharePoint server or farms where PowerPivot for SharePoint and Excel Services are installed. The advantage is –
- The PowerPivot for SharePoint components process the data
- Excel Services renders it in a browser window enabling other users to analyze the data.
- PowerPivot services on SharePoint add collaboration and document management support for the PowerPivot workbooks
- PowerPivot for SharePoint provides
- new type of document library allowing rich previews of the reports in PowerPivot workbooks
- Provides ability to create Reporting Services reports from data in your published PowerPivot workbooks
- Capable of scheduling automatic refresh of PowerPivot data from external data sources.
References: